
Irrigation performance indicators theory
Water and land productivity, CWP and yield, are used as performance indicators of irrigation and drainage schemes. To assess if the irrigation system is performing optimally or sub-optimally an indicator value has to be compared to a target, standard, reference or benchmark value.
You made a similar comparison in the CWP estimation assignment (topic 4), comparing rice CWP with an average value reported in the literature. This comparison was useful from a didactic point of view to check that the range of computed CWP values is adequate. However, as an irrigation performance indicator benchmarking, comparison to a random literature value is not a recommended approach due to possible climatic conditions and plant variety differences.
Appropriate benchmark values are given by the person or organization who ordered the irrigation performance assessment. In the absence of a reliable benchmark value, we can use (1) temporal or (2) spatial analysis. Usually, the target value is defined as the 95th percentile of the achieved (CWP and yield) values.
The values above the target value are called bright spots. In the bright spots the irrigation system works efficiently and lessons can be learned on what to improve in the other points.
For the values below the target we can compute how large the productivity gap, the difference between the target and the achieved value, is. These are treated as lost profit.
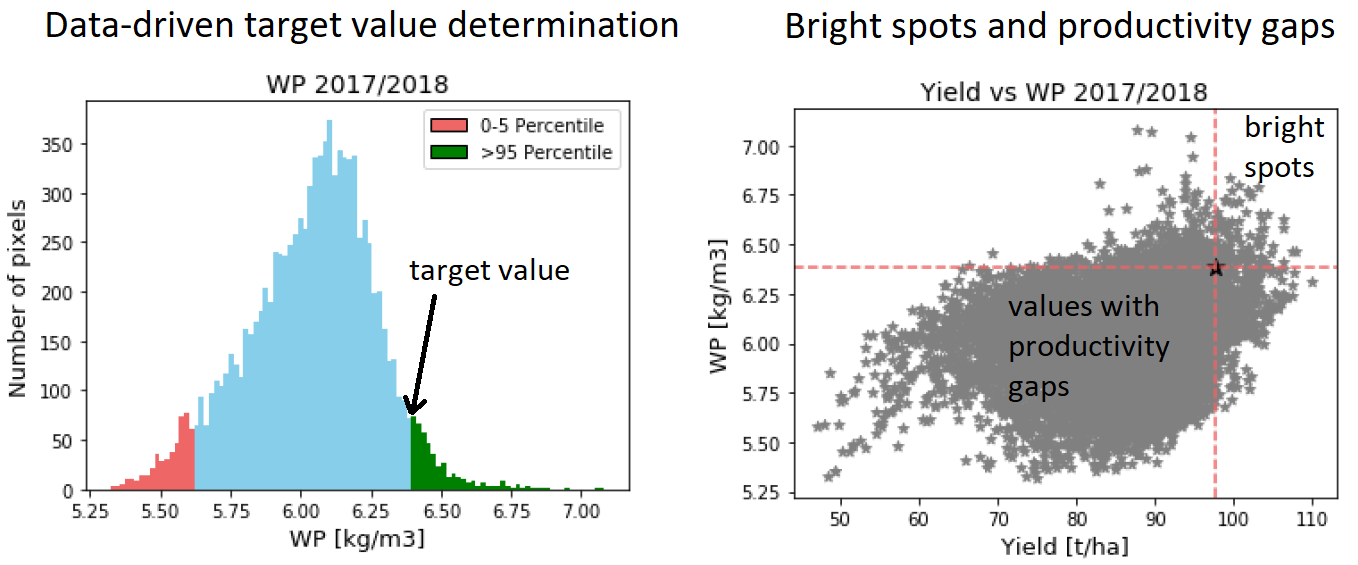
Figure from Chukalla et al., 2021