
Phenology from EO theory
Crop water productivity is defined per growing season. To accumulate GPP to yield (see previous topic) and evapotranspiration to water usage in the area we have to define the aggregation period, start and end of the growing season. The start of the season (SOS) and the end of the season (EOS) are called phenological metrics, as phenology studies seasonal changes in vegetation.
There have been several toolboxes available for phenological metrics extraction from various remote sensing indicators (such as NDVI time series). TIMESAT and DATimeS are two of the most common toolboxes.
In our course, we are going to limit ourselves to visual inspection of NPP time series. As was discussed in Topic 1, WaPOR uses the LUE model to come up with NPP. In this case, NPP is nothing else than a transformed NDVI, which bears all traces of phenology and potentially suppresses all noise and outliers.
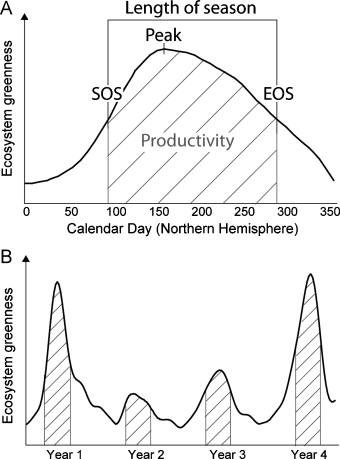
Phenological metrics from Bradley et al., 2012
Reading task:
Please, go through sub-sections 2.1.4 Phenology (raw pdf pp 30-32, document pp 18-20) and 2.1.7 Total biomass production (raw pdf pp 47-49, document pp 35-37) of the WaPOR v2 methodology.
Answer the following question:
- For which Level (1, 2 or 3) is this Phenology layer available?